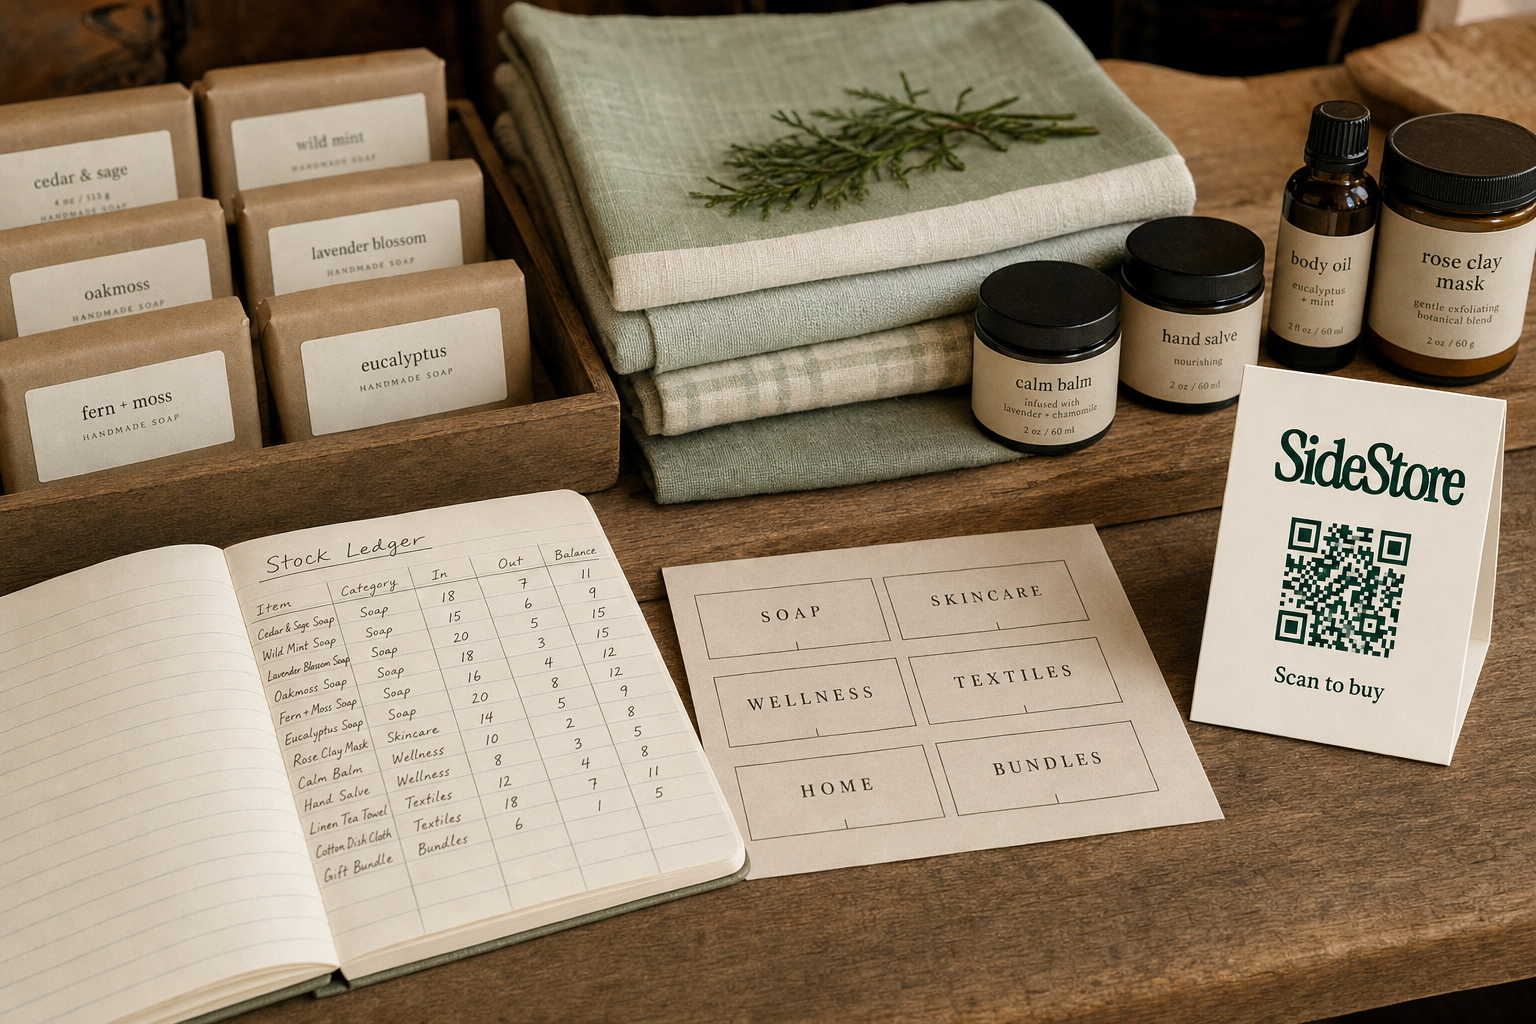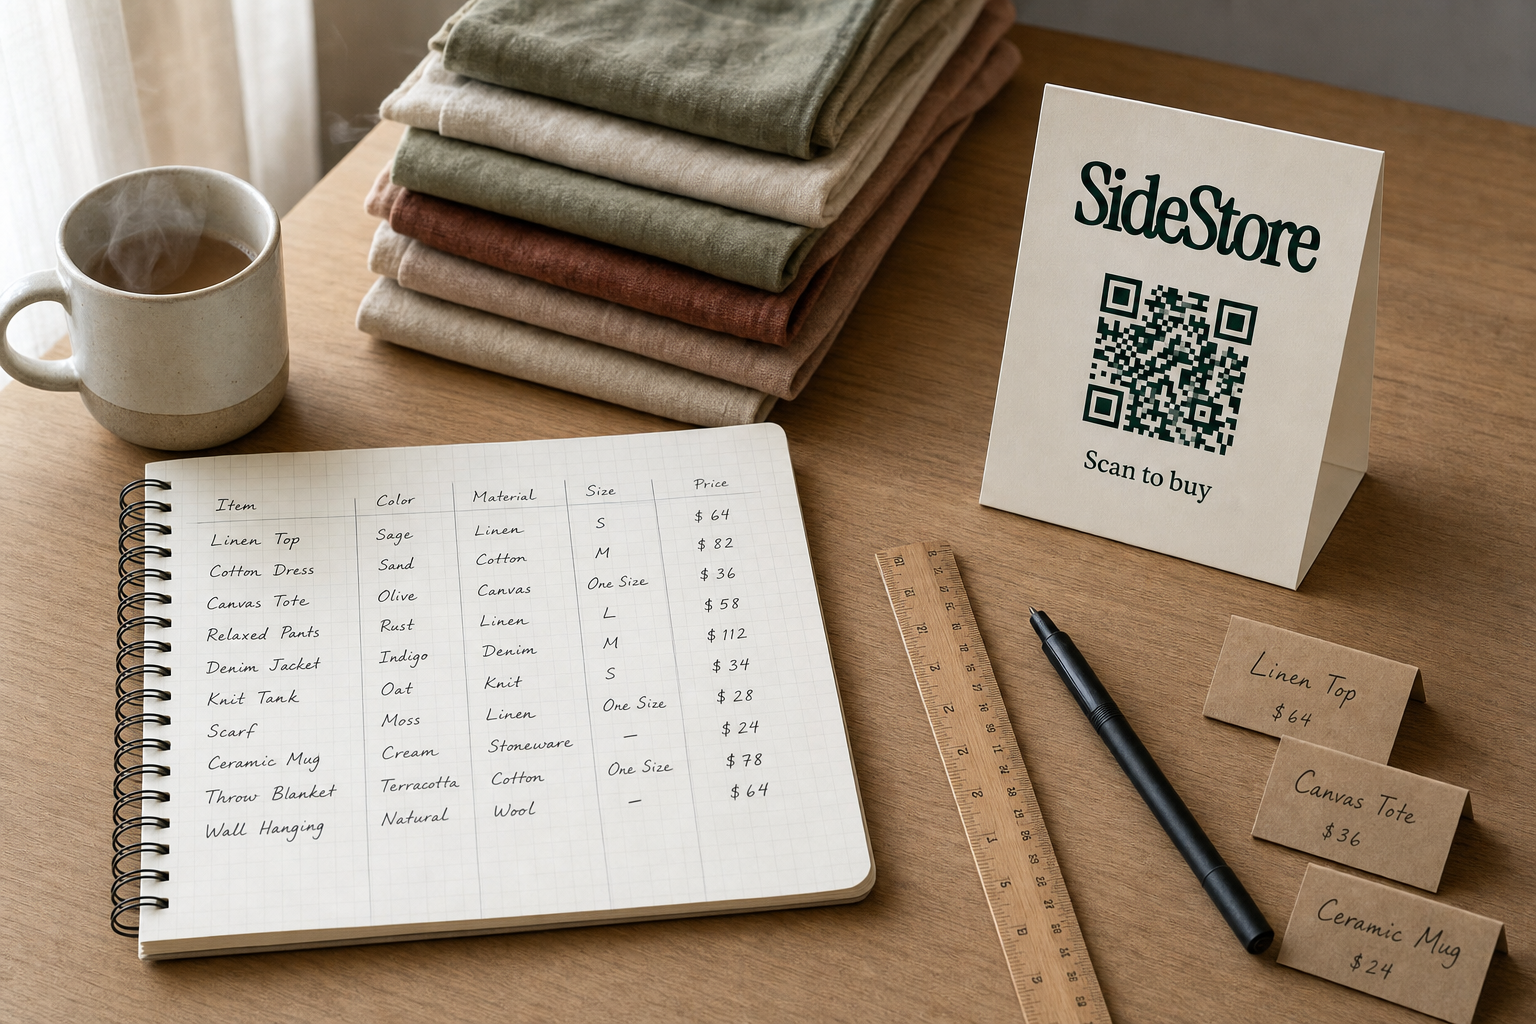
A boutique inventory spreadsheet is a structured document that records every product you stock: quantity, cost, price, and location. It gives you a single source of truth for what you own, what you owe makers or suppliers, and what needs reordering. If you run a boutique, a basic spreadsheet is often the fastest way to start tracking stock without paying for software. You need, at minimum, columns for SKU, product name, quantity on hand, cost price, sell price, reorder point, and supplier. Add a location column if you sell from more than one spot, and an ownership type column if you carry consignment stock. For a deeper look at the discipline behind the numbers, see boutique inventory management. If you are still deciding how much stock to order before opening, the guide on how much inventory you need to start a boutique covers that decision separately.
The Essential Columns Every Boutique Inventory Spreadsheet Needs
Your boutique inventory spreadsheet needs, at minimum, ten columns. The exact names matter less than having one column per data point. Here they are, with the purpose of each explained:
1. SKU (Stock Keeping Unit) A unique code you assign to each product variant. Without it, two products with similar names create duplicate rows and counting errors. Keep SKUs short, consistent, and never reuse them.
2. Product Name The plain-language name. This is what your team reads on the shop floor, so make it unambiguous. "Linen Tote Natural" beats "Tote 01."
3. Category Grouping products by category lets you filter and subtotal quickly. Useful when you want to see, for example, how much capital sits in knitwear versus ceramics.
4. Supplier or Maker Track where each product came from. When a quality issue surfaces or a reorder is needed, you want the source one column away, not buried in email.
5. Cost Price What you paid per unit, including any shipping or import cost. Without an accurate cost price, your margin calculations are guesswork.
6. Sell Price
Your retail price. Keep this separate from cost price so your margin formula stays clean: =(Sell Price - Cost Price) / Sell Price.
7. Quantity on Hand The current physical count. Update this every time stock moves.
8. Reorder Point The quantity at which you place a new order. To calculate it: multiply your average daily sales by your supplier lead time in days, then add a safety buffer. Example: if you sell 3 units per day and your supplier takes 5 days to deliver, your reorder point is 15 units, plus whatever safety stock makes sense for your cash flow.
9. Location Which shop, market table, or consignment placement holds the stock. A single column here becomes the foundation for multi-location filtering later.
10. Ownership Type Flag each row as "owned" or "consignment." This distinction matters for your balance sheet: consigned goods are not your asset. When browsing boutique inventory for sale to source new products, ownership type is the first question to answer before the item lands on your shelves.
11. Consignment Split % For any row flagged as consignment, record the agreed maker split. If a maker receives 60% of each sale, log 60 here. This feeds the payout arithmetic covered in the consignment section below, and keeps your settlement records clean across all your consignment stock in one view.
How to Build Your Boutique Inventory Spreadsheet: A Step-by-Step Setup
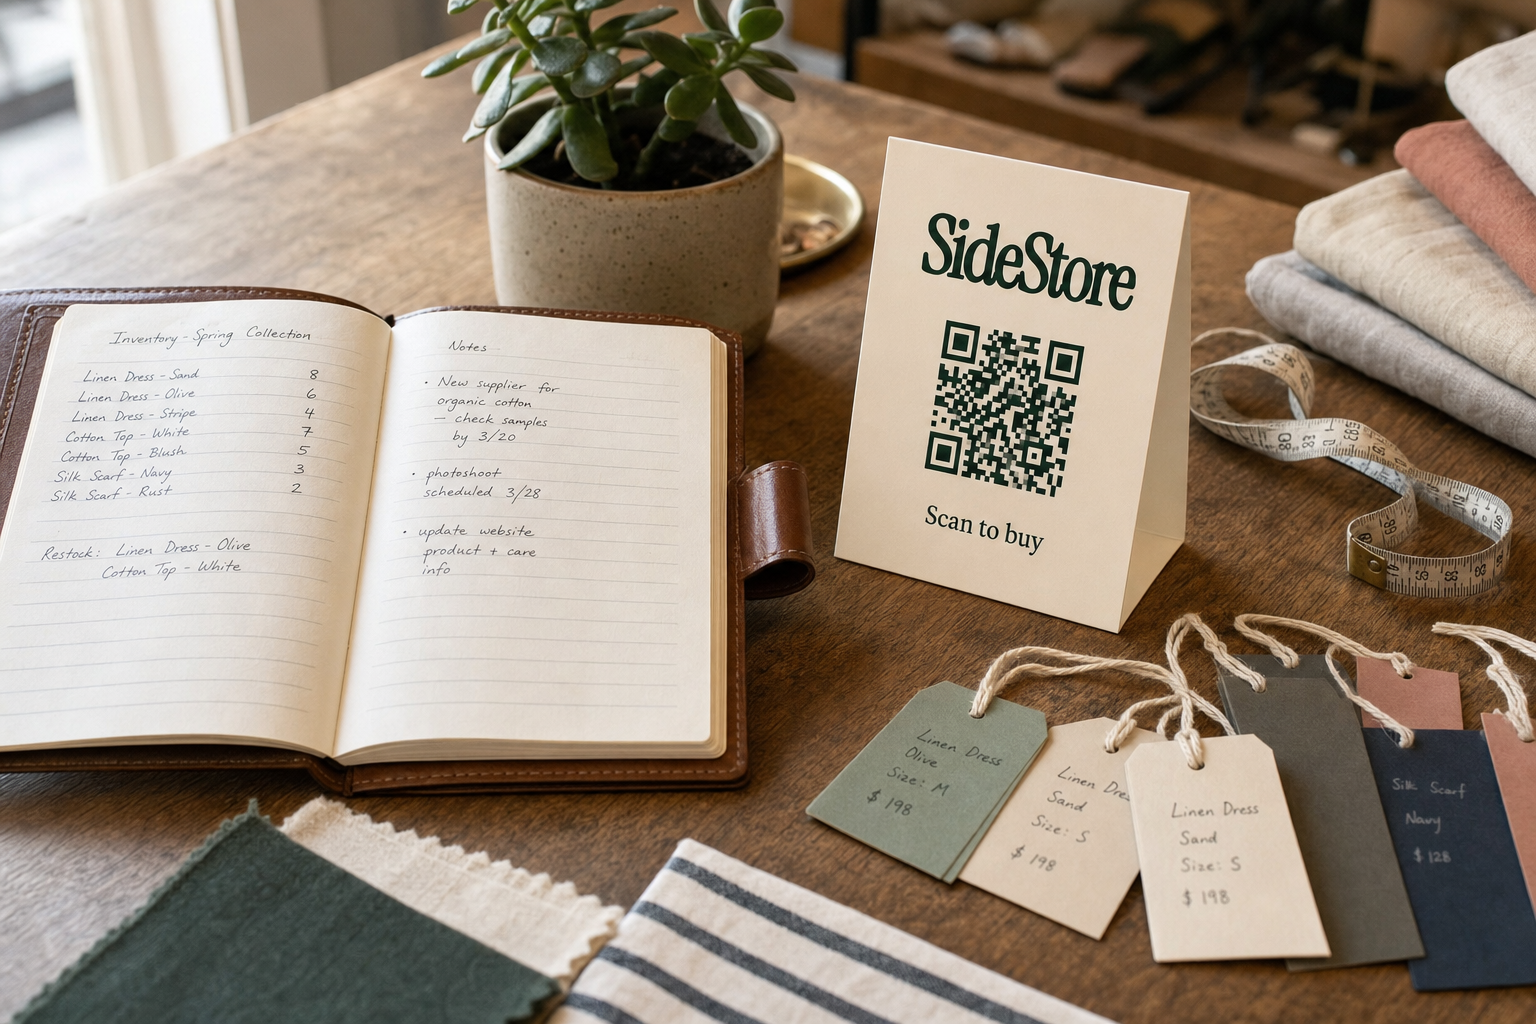
Building a boutique inventory spreadsheet correctly from the start saves hours of untangling later. Open a blank sheet and follow these steps in order, because each one depends on the last.
Step 1: Create your column headers in row 1. Lock row 1 as a frozen header so it stays visible when you scroll. In Google Sheets: View > Freeze > 1 row. In Excel: View > Freeze Panes > Freeze Top Row. This is non-negotiable once your list exceeds 50 rows.
Step 2: Enter your full product list, one row per SKU. Do not combine variants (size, colour) into one row. A small blue ceramic mug and a large blue ceramic mug are different SKUs. Combining them means your quantity counts are wrong from day one. Before you begin, consult your thinking on how much inventory to start with so you are not building a spreadsheet that immediately exceeds what you can physically manage.
Step 3: Add a Quantity In and Quantity Out log on a second sheet. Name it "Transactions." Every time stock arrives or sells, add a row: date, SKU, movement type (IN or OUT), quantity, and location. The master sheet then pulls a live count using SUMIF.
Step 4: Write the SUMIF formula to calculate Quantity on Hand automatically. In your master sheet's "Quantity on Hand" column, the formula pattern is:
=SUMIF(Transactions!B:B, A2, Transactions!D:D)
Where column B in Transactions holds your SKU, A2 is the current row's SKU in the master sheet, and column D in Transactions holds the quantity (positive for IN, negative for OUT). This means you never manually edit the quantity on hand, which eliminates one of the most common counting errors.
Step 5: Add conditional formatting to flag reorder points.
Highlight the Quantity on Hand cell in red when it falls at or below the Reorder Point value. In Sheets or Excel, use a custom rule: =C2<=E2 (where C2 is Quantity on Hand and E2 is Reorder Point). Your reorder alerts become visual without any extra effort.
Step 6: Protect the formula columns. Lock any column containing a formula so staff cannot accidentally overwrite it. Log all stock movements in the Transactions sheet only. Good inventory management practices depend on keeping the input layer separate from the calculation layer.
Tracking Stock Across Multiple Selling Locations in One Spreadsheet
A spreadsheet can track stock across more than one location, but only if you design for it from the start. The Location column in your master sheet and the Location column in your Transactions log are what make it work.
With a Location column in your Transactions sheet, you can filter quantity on hand by location using a two-condition SUMIF (or SUMIFS in Excel and Sheets):
=SUMIFS(Transactions!D:D, Transactions!B:B, A2, Transactions!E:E, "Market Stall")
This returns the quantity of that SKU at the Market Stall location only. Duplicate the formula for each location and you get a per-location stock view without a separate spreadsheet per location.
A pivot table is the faster option for a quick multi-location overview. Drop SKU into rows, Location into columns, and sum Quantity. You get a grid that shows every product across every location at once.
That said, be honest about where this breaks. Once you are managing more than three or four locations, updating the Transactions log consistently across your team becomes the real challenge. Human error in data entry compounds: a row entered with a typo in the location name silently drops out of your SUMIFS filter. Understanding how consignment settlements work across multiple spots adds another layer of reconciliation. And if you are looking at clearing slow-moving stock across several placements, manual spreadsheet filtering can miss what an automated system catches instantly. A spreadsheet scales to about three locations reliably. Beyond that, dedicated software earns its cost.
Spreadsheet vs. Dedicated Inventory Software vs. Consignment Platform: A Decision Table
Which solution fits your boutique right now depends on your number of SKUs, your number of selling locations, and whether you carry consignment goods. The table below gives you a plain comparison you can use as a decision rule.
| Solution | Best For | Monthly Cost | Key Strength | Key Limit |
|---|---|---|---|---|
| Spreadsheet (Google Sheets / Excel) | 1 location, under 200 SKUs, owned stock only | Free | Full control, no subscription, easy to customise | Manual data entry, no automatic reorder alerts, error-prone at scale |
| Dedicated inventory software (e.g. Lightspeed, Vend) | Multi-location retailers, 200+ SKUs, POS integration needed | $50-$250+ | Automatic stock sync, barcode scanning, reporting | Monthly cost, setup time, overkill for small boutiques |
| Consignment platform (e.g. SideStore Retail Widget) | Boutiques carrying maker goods on consignment across multiple placements | Varies | Automatic split settlement, placement attribution, live stock tracking per location | Designed for consignment management, not a general inventory tool for owned stock |
Decision rule: Stay on a spreadsheet while you have one location, fewer than 200 SKUs, and time to update stock movements daily. Move to dedicated inventory software when you add a second permanent location or a POS system. Consider the SideStore Retail Widget specifically for the consignment slice of your stock, particularly if you are starting a boutique without carrying inventory and consignment is your primary model. If you are exploring alternatives to weekend markets as a distribution channel, the Retail Widget handles the placement mechanics that a spreadsheet cannot automate: automatic split settlement to makers, placement attribution by location, and live stock tracking that updates the moment something sells.
Five Common Boutique Inventory Spreadsheet Mistakes (and How to Avoid Them)
Most boutique inventory spreadsheets fail for one of five reasons, and each failure is predictable. Knowing the pattern lets you design around it.
1. No separation between input and calculation. When staff type directly into formula cells, they overwrite formulas without realising it. Fix: lock all formula columns and route every stock movement through the Transactions log only.
2. Merging variants into a single row. Combining sizes or colours into one row with a comma-separated note seems tidy until you need to count a single variant. Fix: one row per SKU, always. If that feels like too many rows, it means you have more SKUs than you thought, which is useful information.
3. Inconsistent naming. "Blue Mug," "blue mug," and "BlueMug" are three different strings to a SUMIF formula. One typo breaks your location filter silently. Fix: use a dropdown validation list for product names, locations, and ownership types. It takes ten minutes to set up and prevents category-level miscounts.
4. No physical audit schedule. The spreadsheet drifts from reality over time if you never verify it against a physical count. This is one of the most frequent issues in boutique stock management, and the gap widens fastest with sourcing boutique inventory from multiple suppliers at irregular intervals. Fix: schedule a partial audit weekly and a full count monthly, at minimum.
5. Ignoring the opening inventory baseline. If your opening stock count was rough, every subsequent calculation compounds the error. Fix: before you go live with the spreadsheet, count everything physically and enter those numbers as your starting point. The guide on sizing your opening inventory walks through how to think about that initial count before you place your first orders.
Tracking Consignment Stock in Your Boutique Spreadsheet
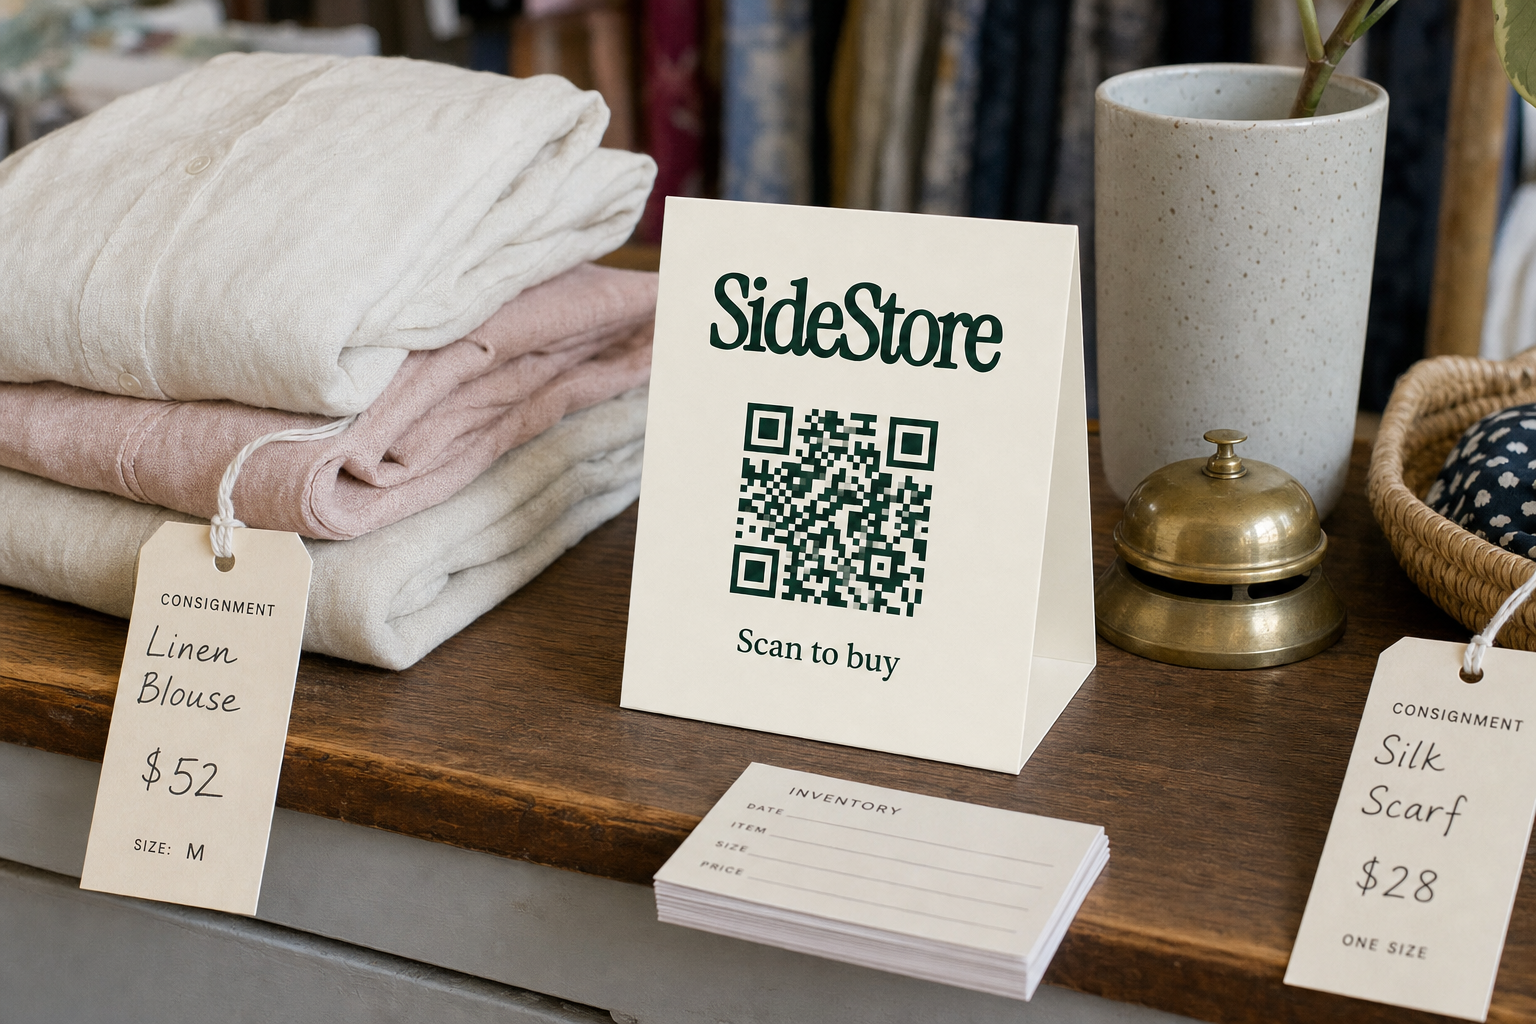
Consignment stock can live in the same spreadsheet as your owned stock, but you need four extra columns to keep the accounting clean. Without them, you cannot tell your margin from a maker's payout.
The four columns to add for every consignment row:
- Ownership Type, "consignment" or "owned." Filters your balance sheet view instantly.
- Maker/Supplier Name, who the goods belong to until sold.
- Consignment Split %, the maker's agreed percentage of the sale price.
- Payout Due, a calculated field:
=Sell Price * (Consignment Split % / 100) * Units Sold.
Worked example: a candle retails at $40. The maker's split is 60%. You sell 5 units. The payout due is $40 × 0.60 × 5 = $120. That $120 is not your revenue. Keeping it in a separate column stops it from inflating your profit figures.
For a fuller picture of how selling on consignment works as a model, and what your obligations are to the maker, the linked article covers the structure in detail. When you are running consignment placements across more than one or two makers, manual payout tracking in a spreadsheet becomes error-prone quickly.
The SideStore Retail Widget is worth considering at that point. It handles split settlement and placement attribution automatically, so the payout calculation happens without a formula you have to maintain. It is designed specifically for consignment management, not as a replacement for your full inventory spreadsheet. It also gives you a printable QR code card for each placement so customers can scan and buy directly, with automatic split payouts to each maker.
Frequently Asked Questions
These are the questions boutique owners most commonly raise once they have built their first inventory spreadsheet and started running into its edges.
What is the best free spreadsheet template for boutique inventory?
Google Sheets is the most practical starting point because it is free, accessible from any device, and supports the SUMIF and SUMIFS formulas you need for multi-location tracking. Microsoft Excel offers more computational headroom for large data sets, but requires a Microsoft 365 subscription. Build your own template using the column structure in this article rather than downloading a generic retail template, because most generic templates omit ownership type and consignment columns entirely.
How many SKUs can a spreadsheet handle before it becomes too slow?
As a general guide, Google Sheets handles around 300 to 500 SKUs without noticeable lag, provided you are not running dozens of SUMIFS formulas across tens of thousands of transaction rows. Excel handles more. Beyond those approximate thresholds, formula recalculation slows on standard hardware. The practical limit is often your team's data entry discipline, not the software's row limit. For guidance on keeping your SKU count manageable from the start, see how much inventory to start with for an online boutique.
Do I need a separate spreadsheet for consignment stock?
No. A single spreadsheet with an Ownership Type column and a Consignment Split % column keeps everything in one place and makes filtering straightforward. A separate spreadsheet creates a reconciliation problem: you have to cross-reference two files every time you do a stock count or payout calculation. Good boutique inventory management runs on a single source of truth.
How often should I audit my physical stock against the spreadsheet?
Audit a subset of fast-moving products weekly and run a full physical count monthly. The longer the gap between audits, the wider the discrepancy tends to grow, and the harder it becomes to identify where the error entered the system. Shrinkage, misplaced stock, and data entry errors all compound silently between counts.
Build the Spreadsheet Now, Plan Your Next Step
Start today: open a blank sheet, freeze row 1, and enter the eleven columns from this guide. Add your full product list, set up the Transactions log on a second tab, and write the SUMIF formula for Quantity on Hand. That is a working boutique inventory spreadsheet. As your location count grows, revisit the decision table and the consignment tracking columns. If you are exploring alternatives to weekend markets for selling your products or considering how to start a boutique without holding inventory, those articles cover what comes next.