Retail Sell-Through Rate: How to Calculate It and What to Do When It's Low
Learn how to calculate retail sell-through rate, what benchmarks to target by category, and seven actions to take when your rate is low. Includes consignment guidance.

Retail sell-through rate is the percentage of your received inventory that sells within a defined period. The formula: (Units Sold ÷ Units Received) × 100. Receive 50 units of a ceramic mug, sell 35 in a month, and your retail sell-through rate is 70%. That single number tells you whether your product, your placement, and your pricing are working together.
This article covers how to calculate the rate step by step, what a good sell-through rate looks like across retail categories, why yours might be low, and seven concrete actions to improve it. It also addresses a common source of confusion: sell-through rate and conversion rate measure different things entirely. For consignment placements specifically, there is a dedicated section on what changes when your capital is sitting on someone else's shelf.
For context on what counts as a strong target for your category, see what is a good sell-through rate in retail.
How Is Sell-Through Rate Calculated?
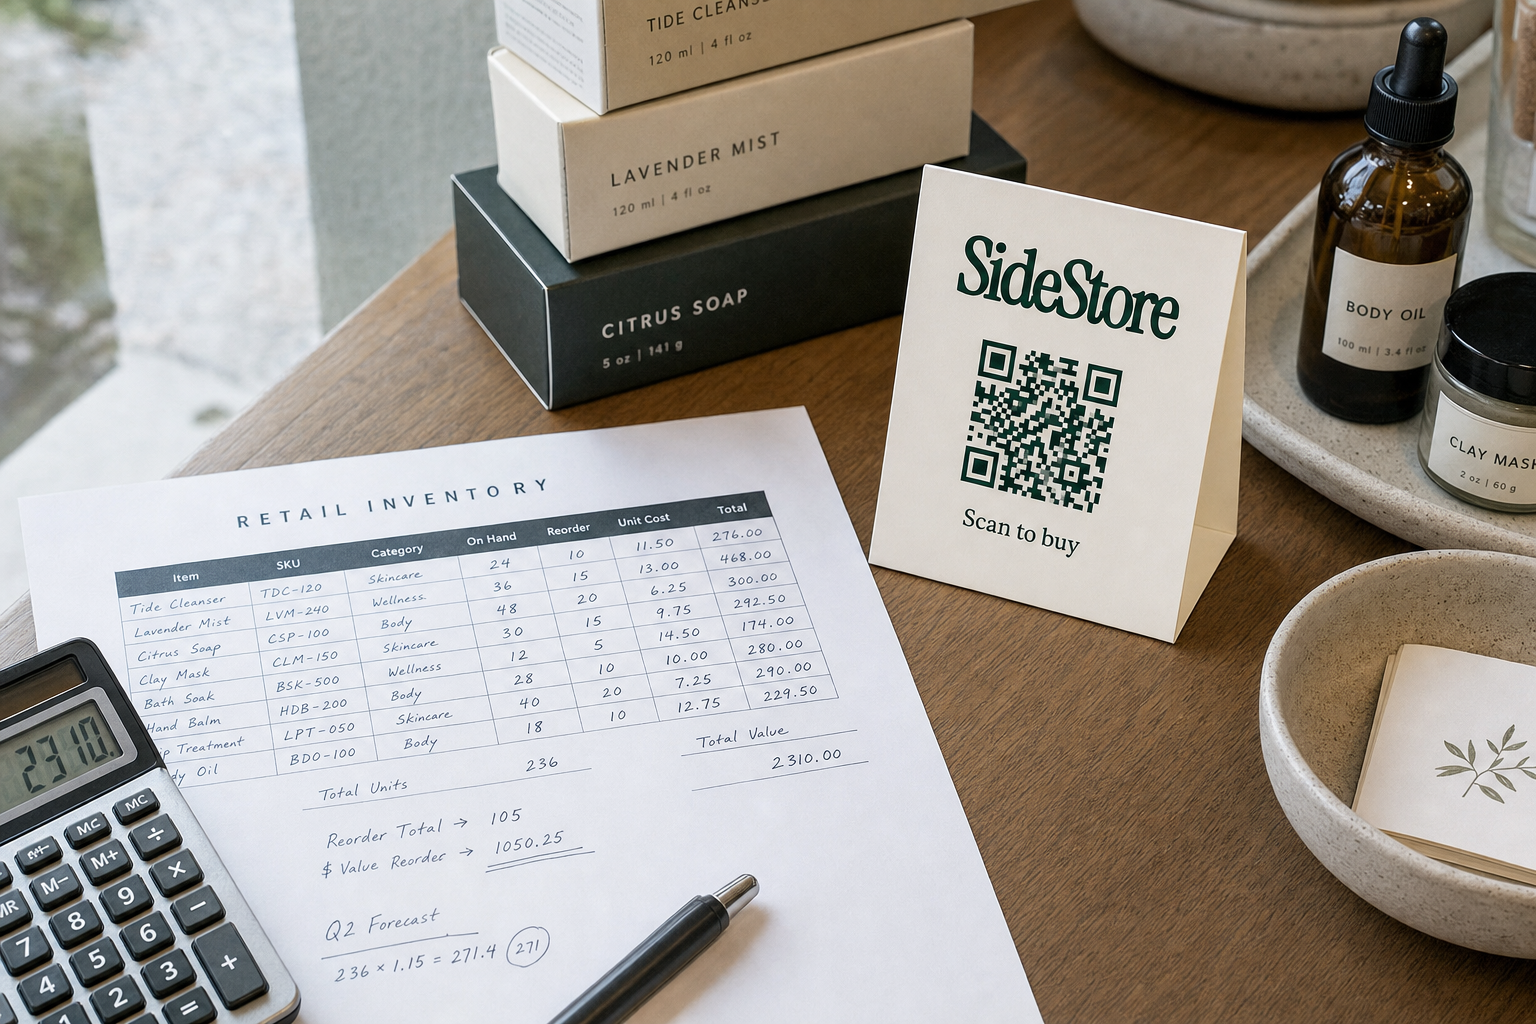
Sell-through rate divides units sold by units received in a period, then multiplies by 100. Everything else clarifies what belongs in each variable.
The formula:
Sell-Through Rate (%) = (Units Sold ÷ Units Received) × 100
Use units received as your denominator: opening stock plus any new deliveries during the period. Never divide by ending inventory. Dividing by what remains inverts the logic and produces a figure you cannot compare across periods or between locations.
Step-by-step worked example:
| Step | Detail | Figure |
|---|---|---|
| Opening stock | Units on shelf at period start | 40 units |
| New delivery | Mid-month replenishment | 20 units |
| Units received | Total available (40 + 20) | 60 units |
| Units sold | Confirmed sales by period end | 42 units |
| Sell-through rate | (42 ÷ 60) × 100 | 70% |
Substitute your own counts to get a meaningful result.
Time period matters. A 70% sell-through in one week signals very different velocity than 70% over a quarter. Fix the period before comparing across products or locations. Monthly is standard for boutique and consignment contexts; weekly suits fast-moving goods.
The common mistake: Some operators divide by ending inventory rather than units received. This produces wildly different figures depending on how much stock remains and makes cross-period comparison impossible. The denominator is always what came in, not what is left.
Accurate inputs require accurate counts. Tracking your boutique inventory with a consistent system, rather than periodic stocktakes, gives you the most usable sell-through figures.
What Constitutes a Good Sell-Through Rate in Retail?
A widely cited benchmark for seasonal retail is 80% sell-through by the end of a selling window. Hit 80% and your buying was well-calibrated to demand. Fall significantly below it and you are carrying residual stock that ties up space and, in many cases, working capital.
That said, 80% is not universal. Category, margin structure, and venue type all shift the target.
Observed ranges by retail context:
| Context | Typical sell-through range | Notes |
|---|---|---|
| Seasonal boutique apparel | 75, 85% | By end of season; markdowns often used to clear remainder |
| Café retail shelf (gifts, pantry) | 60, 80% | Lower footfall-to-buyer ratio; reorder cadence varies |
| Hotel gift or amenity display | 55, 75% | Impulse-led; placement position drives performance sharply |
| Handmade / craft consignment | 50, 80% | Depends heavily on price point and category |
| Fast fashion / high-volume | 85%+ | Low margin tolerance for dead stock |
Higher-margin products tolerate a lower sell-through rate because each unit that sells covers more fixed cost. A maker selling hand-stitched bags at a strong margin can sustain 55, 60% sell-through and still earn well. A low-margin product at the same rate represents a structural problem.
A note on stockout risk. Consistently hitting 95% or above is not always a sign to celebrate. It can indicate you are undersupplying the placement, missing sales when stock runs out before your next restock cycle. If your rate regularly exceeds 95%, increase your delivery quantity or shorten your restock interval before that placement costs you sales you never see.
See sell-through benchmarks by category for a deeper breakdown, and boutique inventory management for practical guidance on calibrating your buying to your target rate.
Sell-Through Rate vs Conversion Rate: They Measure Different Things
Sell-through rate and retail conversion rate are not the same metric. Sell-through rate measures what percentage of your stock sold. Conversion rate measures what percentage of visitors to a space made a purchase. Both are useful; neither replaces the other.
| Metric | What It Measures | Input Data Needed | When to Use It |
|---|---|---|---|
| Sell-through rate | Stock liquidation: what percentage of received inventory was sold | Units received, units sold, time period | Evaluating product viability, buying decisions, placement health |
| Retail conversion rate | Visitor behaviour: what percentage of foot traffic bought something | Visitor count, number of transactions | Evaluating the effectiveness of a space, layout, or sales environment |
The diagnostic this creates: If your conversion rate is healthy (visitors are buying) but your sell-through rate is low, the problem is not product appeal. It's placement. You likely have the wrong product in the wrong location, too much stock for the space's actual footfall, or an assortment mismatch.
High conversion plus low sell-through points to a quantity and placement problem. Low conversion plus high sell-through points to a traffic problem. They lead to different solutions.
This distinction matters particularly in retail space sharing arrangements, where a host merchant may show strong overall conversion while an individual maker's consignment placement underperforms. The aggregate number masks the placement-level signal.
Why Is Your Sell-Through Rate Low? Six Causes to Check
A low retail sell-through rate traces to one of six causes. Identify which one applies before acting; the remedies differ significantly.
1. Seasonal mismatch. You placed a product outside its natural selling window. Woollen goods in summer, candles in a beachside café in July, or winter accessories in March are structural mismatches. Repositioning helps at the margins, but the calendar works against you. The fix is forward-planning your placement calendar to match stock type to season.
2. Wrong location for the product. A high-craft, high-ticket item placed in a high-volume, low-dwell-time space will not sell at pace. Cafés work well for impulse purchases below a certain price threshold; they are harder venues for considered purchases. Dwell time and buyer intent need to match what you are selling.
3. Overstock relative to footfall. You delivered more units than the placement's realistic sales capacity. A space with 150 visitors per week and a 4% conversion rate for your category will sell roughly six units weekly. Delivering 80 units to that space sets you up for a low rate regardless of product quality. This is a buying and placement-negotiation problem, not a product problem.
4. Pricing out of step with the context. Price point needs to match the ambient expectations of the host venue's customers. A product priced at three times what customers expect to spend on an impulse purchase will sit regardless of quality or presentation.
5. Poor visibility or presentation. Stock sitting below eye level, behind competing product, or without clear pricing underperforms identical stock displayed prominently. This is a merchandising problem. Many operators see a measurable lift from repositioning alone, before changing price or product.
6. Tracking lag masking real performance. If you count stock manually and infrequently, your low sell-through rate may be a data problem rather than a sales problem. You might have sold more than your count reflects, or out-of-stocks you have not caught are suppressing your measured rate. Consignment inventory management software removes this ambiguity by tracking stock live, per placement.
Before you pull a product from a location, verify your data. Many operators who move to systematic tracking find their actual sell-through differs from what they calculated manually. If selling through someone else's store, accurate per-location data is the difference between pulling a placement that is genuinely underperforming and pulling one that is working fine.
How to Improve Sell-Through Rate: Seven Actions to Take Now

Improving your retail sell-through rate starts with diagnosing the cause. Once you know what is driving the problem, these seven actions address the most common corrective levers.
1. Tighten your buying relative to footfall. Calculate the realistic sales capacity of each placement before you deliver stock. A space with 200 visitors per week and a 3% conversion rate for your product category will sell roughly six units weekly. Order to that ceiling, not to your production capacity.
2. Reprice before you restock. If velocity is low and visibility is not the problem, test a price adjustment before delivering more units. A modest reduction often shifts more units than any display change, and the margin compression is frequently offset by reduced clearance losses at season end.
3. Reduce friction at the point of decision. Unclear pricing or lack of product context causes visitors to hesitate and walk away. The SideStore Retail Widget includes a printable scan-to-pay QR card that a maker can attach directly to their product, or a merchant can display for all the consignment products in their placement. Scan-to-pay removes the friction of finding staff, queuing at a till, or uncertainty about whether an item is even for sale. Lower friction at the moment of decision directly supports sell-through.
4. Reposition within the space. Move product to eye level. Place it near the point of payment, or next to a high-sell-through complementary item. Repositioning within the same space costs nothing and frequently produces a measurable lift without touching price or product.
5. Rotate to a better-matched location. If the host venue's customer profile genuinely does not match your product, rotating to a different placement is more effective than optimising endlessly in the wrong space. Idle shelf space exists across many venue types; the right venue match matters more than sheer volume of placements.
6. Monitor sell-through live, by location. Waiting for a monthly stocktake to discover a placement has stalled costs weeks of potential corrective action. The SideStore Retail Widget tracks stock live by placement and SKU, so you see stagnation as it develops. This is especially useful across multiple venues, such as café and coffee shop retail placements, where footfall can vary sharply between sites.
7. Use clearance windows deliberately. If seasonal stock is not clearing at full price with four weeks remaining in the window, mark it down early enough to shift units. A controlled markdown in week eight of a twelve-week season typically recovers more margin than a last-minute clearance at week eleven.
Boutique inventory tracking gives you the baseline data that makes all seven of these actions possible. Without reliable stock counts, you are acting on guesswork.
Sell-Through Rate in Consignment Placements: What Changes and What to Watch
In consignment, your sell-through rate is a cash-flow signal, not just a performance metric. That distinction matters.
In a wholesale model, you have already been paid when you deliver stock. A low sell-through rate is the retailer's problem. In consignment, your products sit in a merchant's space and you earn only when they sell. Every unit that does not sell is working capital sitting idle, in a location you may not be able to monitor in real time. A low sell-through rate in a consignment placement means your money is not moving.
This makes per-placement tracking essential. You need to know not just your aggregate sell-through across all locations, but which specific placement, which SKU, and which period is underperforming. A strong rate at one location can mask a stalled placement elsewhere, and in consignment that stalled placement represents both opportunity cost and retrieval logistics.
A worked example of the cash-flow difference:
Suppose you have 30 units placed across three venues, 10 per site, priced at £20 each with a 60/40 maker-host split. At 80% sell-through across all three sites you earn £288 (24 units × £12). At 50% sell-through you earn £180 (15 units × £12). The difference is not an abstract percentage point gap; it is £108 sitting on shelves rather than in your account, while you may already be producing the next batch.
The SideStore Retail Widget tracks stock live by placement and SKU. When a product sells, automatic split settlement pays both the maker and the host immediately, with no waiting for periodic reconciliation. You see the rate moving, or not moving, in real time.
Understanding how your earnings are structured matters too. Review consignment split arrangements before setting pricing, and ensure your consignment agreement terms specify reporting and restock obligations clearly. If you are building across multiple venues, distributed consignment networks operate on exactly the same sell-through logic at scale: more placements amplify the need for reliable per-site data, they do not simplify it.
Frequently Asked Questions
How is sell-through rate calculated? Divide units sold by units received in a period, then multiply by 100. Units received equals your opening stock plus any new deliveries in the period. Do not use ending inventory as the denominator. If you received 80 units and sold 56, your sell-through rate is 70%.
What constitutes a good sell-through rate in retail? An 80% sell-through by the end of a seasonal window is a widely cited benchmark for retail apparel. Other categories run lower: café and hotel gift retail commonly falls in the 55, 80% range depending on footfall and product type. Consistently exceeding 95% is a stockout risk signal worth monitoring. See sell-through rate benchmarks for category-level detail.
How do UPT and ATV differ as retail metrics? Units Per Transaction (UPT) measures how many items a customer buys in a single visit. Average Transaction Value (ATV) measures how much they spend. Both describe basket behaviour in individual transactions; sell-through rate describes how your total stock is moving over time. They complement each other rather than overlap.
How is average selling price determined? Average selling price is total revenue divided by the number of units sold in a period. A lower average selling price often increases sell-through volume because more buyers find the product accessible, but it compresses margin per unit. The trade-off is worth modelling before you cut price to chase a higher rate. Boutique inventory management tools can help you run these scenarios.
What does sell-through mean in a retail context? Sell-through is the rate at which received inventory is sold within a defined period, expressed as a percentage. It signals whether your product, pricing, and placement are aligned with actual demand in that location and at that time.
How does sell-through rate apply to online marketplaces like eBay? The formula is identical: units sold divided by units listed (your equivalent of units received), multiplied by 100. The practical difference is that units received on eBay means active listings rather than physical deliveries, and the period is typically measured from listing date to sale or expiry.
What is the difference between conversion rate and sell-through rate? Sell-through rate measures how much of your stock sold. Conversion rate measures how many visitors to a space made a purchase. They use different inputs and answer different questions. A high conversion rate alongside a low sell-through rate usually points to a stock quantity or placement problem, not a product problem. See the comparison table in the earlier section for a full breakdown.
Start Tracking, Then Act on What You See
Calculate your sell-through rate for each active placement, then identify which is lowest and why. That sequence, calculate first, diagnose second, act third, prevents the common error of pulling a product that is performing or marking down stock whose real problem is visibility, not price.
For makers managing multiple consignment placements, the Retail Widget gives you live stock tracking per placement and SKU, with automatic split payouts every time a unit sells. You are not waiting for a monthly email from a host merchant to know whether your rate is healthy or stalling.
The formula does not change whether you run one placement or twenty. What changes is how much you can see and how fast you can respond. Per-site data is what turns a sell-through rate from a retrospective number into an active management tool.
Build a consignment network without opening a store of your own.
Ready to place products or find your next venue? Explore placing handmade products in boutiques, alternatives to pop-up retail, and approaching local shops about stocking your products.