What Is a Good Sell-Through Rate in Retail? Benchmarks for Makers and Shop Owners

Sell-through rate is the percentage of inventory sold within a given period. The formula is simple: units sold divided by units received, then multiplied by 100.
For most retail contexts, a sell-through rate of 80% or above is considered strong. Rates between 60% and 80% are acceptable for many categories. Below 60% generally signals a pricing, placement, or product-fit problem. These thresholds are widely cited industry conventions, treat them as benchmarks, not absolutes. A seasonal gift boutique and a hotel lobby gift corner operate on very different cycles, so context always matters.
This article covers how to calculate sell-through rate, what counts as good across different retail settings, how it differs from inventory turnover, and how consignment changes the risk equation when numbers fall short. You'll also see common mix-ups cleared up, including the confusion between sell-through rate and food-label sell-by dates, and how tools like boutique inventory tracking and consignment inventory software make tracking straightforward.
What Is the Meaning of Sell-Through in Retail?

Sell-through rate measures what proportion of the stock you brought in actually sold during a defined period. It tells you how well your inventory is moving, nothing more.
Formula: Sell-Through Rate (%) = (Units Sold ÷ Units Received) × 100
Stock 50 ceramic mugs in October and sell 38 by month-end. Your sell-through rate is 76%.
Two mistakes show up repeatedly in retail conversations, and both are worth correcting.
Mistake 1: Sell-through is not a conversion rate. Conversion rate measures the proportion of shoppers who make a purchase. Sell-through rate measures the proportion of inventory that sells. A store can have a high conversion rate on customers who walk in, while still ending the month with slow sell-through if foot traffic was low and stock levels were high.
Mistake 2: Sell-through has nothing to do with food-labeling dates. "Sell-by date" and "sell-through date" sound related, but they belong to entirely different domains. Food labeling uses sell-by dates to indicate freshness. In retail analytics, a sell-through date is sometimes used to describe the projected date by which a batch of inventory will be fully sold, based on current velocity. They share a word, not a meaning.
Good boutique inventory management depends on understanding sell-through rate in its proper context: as a stock-efficiency metric.
What Counts as a Good Sell-Through Rate?
A sell-through rate above 80% is broadly considered strong. Rates between 60% and 80% are workable for many product categories. Anything below 60% warrants a close look at pricing, product selection, or placement.
These tiers are useful starting benchmarks, not fixed laws. A seasonal product with a compressed selling window will be judged differently from everyday staple goods. Category norms vary significantly, as the table in the next section shows.
One persistent confusion: sell-through rate is not the same as sales per square foot. Sales per square foot is a revenue productivity metric tied to physical space. Sell-through rate is an inventory efficiency metric. A small shelf holding six high-value handmade pieces with an 85% sell-through rate can contribute meaningfully to a store's sales per square foot, but the two numbers measure different things.
Consignment changes the risk calculus for the merchant host in an important way. In a traditional buy-in retail model, low sell-through is painful because the merchant has already paid for the inventory. In a consignment model, the host carries no upfront stock cost. If a placement underperforms, the merchant loses floor space and opportunity cost, but not capital. This makes it meaningfully safer for a host to trial new products through retail space sharing arrangements. The maker, however, bears the inventory risk and time cost, which is why sell-through visibility matters for both parties, even if the stakes are different.
When you sell through someone else's store on consignment, tracking sell-through rate per placement is the clearest way to know whether a specific venue is working.
Sell-Through Rate Benchmarks by Retail Context
Sell-through benchmarks vary by retail setting, product category, and measurement period. A hotel lobby gift corner measures success differently from a fashion boutique or a neighbourhood cafe.
The table below presents widely observed conventions. Ranges vary because no universal authoritative dataset covers all independent retail formats, and real-world results vary by region, season, and product type.
| Retail Context | Typical Measurement Period | Target Sell-Through Rate | Notes |
|---|---|---|---|
| Fashion boutique | Monthly | 80%+ | Seasonal turnover makes high sell-through critical before markdown season |
| Gift and homewares shop | Monthly / Quarterly | 65, 80% | Broader range reflects varied gift cycles and impulse vs. considered purchases |
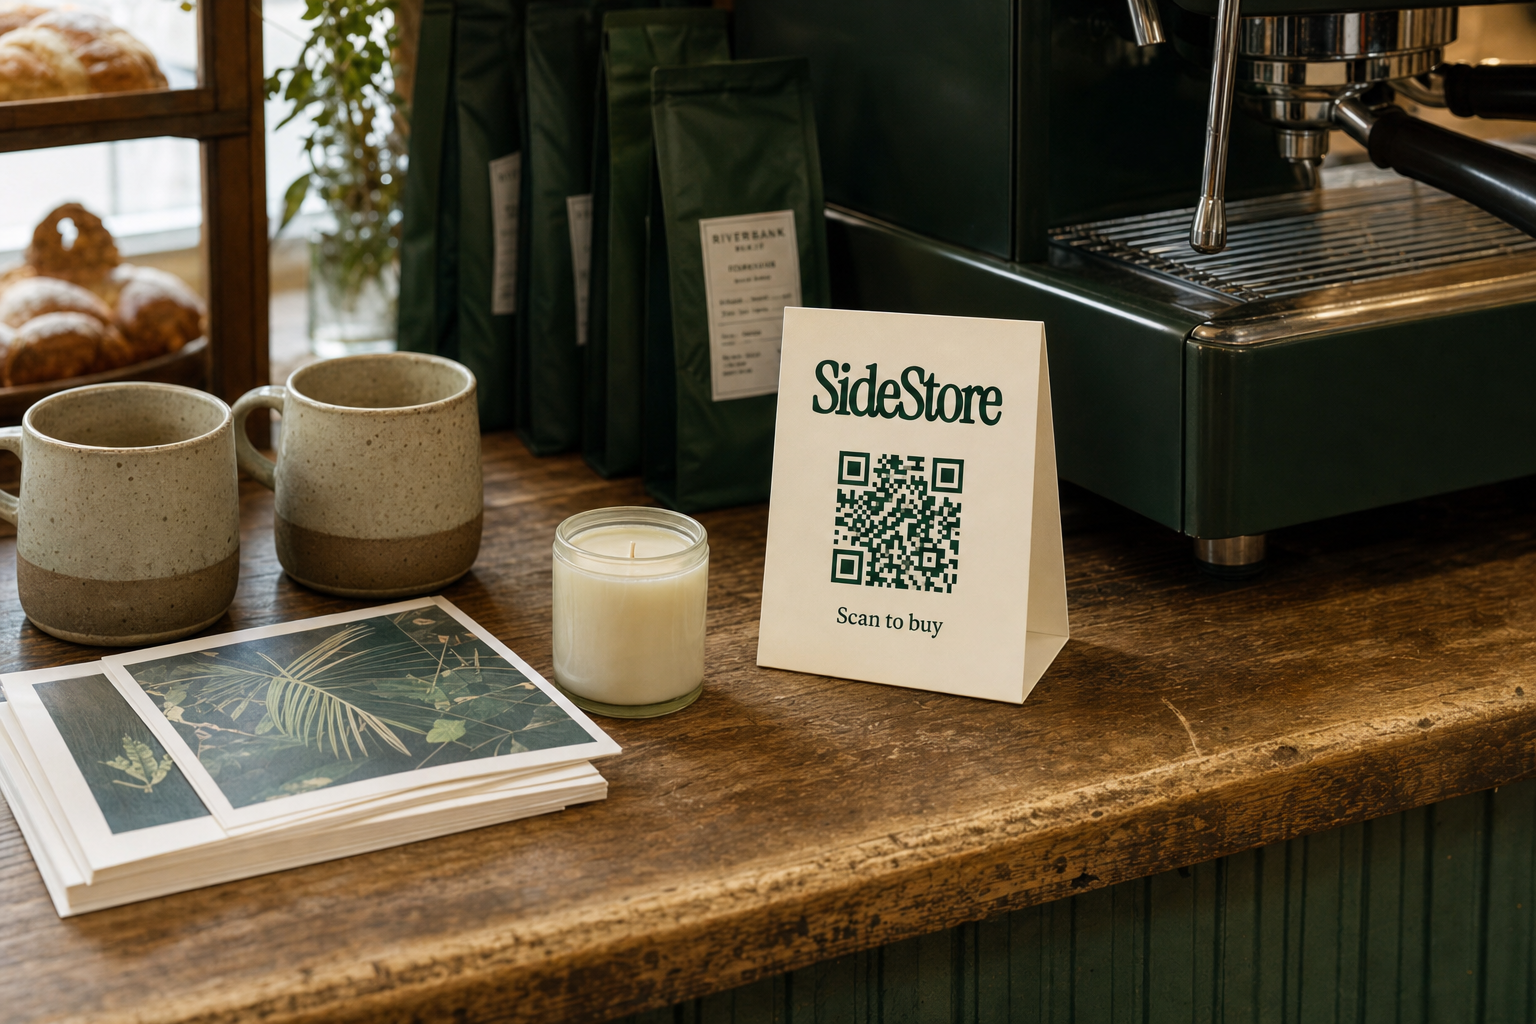
| Cafe or coffee shop retail shelf | Monthly | 70%+ | High foot traffic can drive strong rates; whether a coffee shop counts as retail affects how you benchmark |
| Hotel lobby or B&B retail nook | Weekly / Monthly | 60, 75% | Lower replenishment frequency; guest dwell time is the main driver |
| Consignment placement (any setting) | Monthly | 60, 80% | Host has no stock cost, so a lower rate is tolerable longer; maker still needs to track velocity |
| Online marketplace store | Monthly | 40, 60% | Larger SKU counts and slower seasonal cycles often produce lower rates than physical retail |
A short note on the measurement period. A 70% monthly sell-through rate and a 70% quarterly sell-through rate describe very different inventory performances. Always state the period alongside the rate, or comparisons become meaningless.
For consignment placements specifically, the host merchant bears no inventory cost, so a temporarily low rate does not create financial pressure the way it would in a bought-in stock model. The maker absorbs the carrying cost and time. This is why tracking your boutique inventory by placement, rather than in aggregate, gives you the granularity to act on underperforming venues before the situation compounds.
What Is the Difference Between Sell-Through Rate and Inventory Turnover?
Sell-through rate and inventory turnover are related but distinct metrics. Sell-through rate measures the percentage of received inventory that sells in a period. Inventory turnover measures how many times your average inventory balance cycles through in a year.
Sell-Through Rate (%): (Units Sold ÷ Units Received) × 100
Inventory Turnover (times): Cost of Goods Sold ÷ Average Inventory Value (over a year)
A concrete example. A boutique owner receives 40 candles in September and sells 32 by month-end. The sell-through rate is 80%. If the average inventory value across the year is £2,000 and annual cost of goods sold is £8,000, the inventory turnover is 4 times per year. Both numbers tell something useful. The sell-through rate shows how well September's candle stock moved. The turnover rate shows how efficiently the total inventory investment deployed across the year.
The two metrics get confused because they both signal inventory health. The key difference is time horizon and denominator. Sell-through is typically monthly and stock-count based. Turnover is annual and value based.
Sell-in, sell-through, and sell-out are supply-chain terms that add further precision. Sell-in is what a supplier ships to a retailer. Sell-through is what the retailer then sells to shoppers. Sell-out refers to when a product is fully depleted from shelves. In a direct maker-to-placement model, sell-in and sell-through often collapse into the same event, but the distinction matters when working with distributors or wholesale buyers.
Consignment inventory software and boutique hub inventory tools can track both metrics simultaneously, which removes the manual reconciliation work.
How to Improve a Low Sell-Through Rate
A low sell-through rate almost always traces back to one of three root causes: wrong product for the location, wrong price for the audience, or insufficient visibility in the space.
Diagnose before prescribing. Jumping to discounting without knowing which root cause applies often compounds the problem.
For makers with placements in other people's spaces:
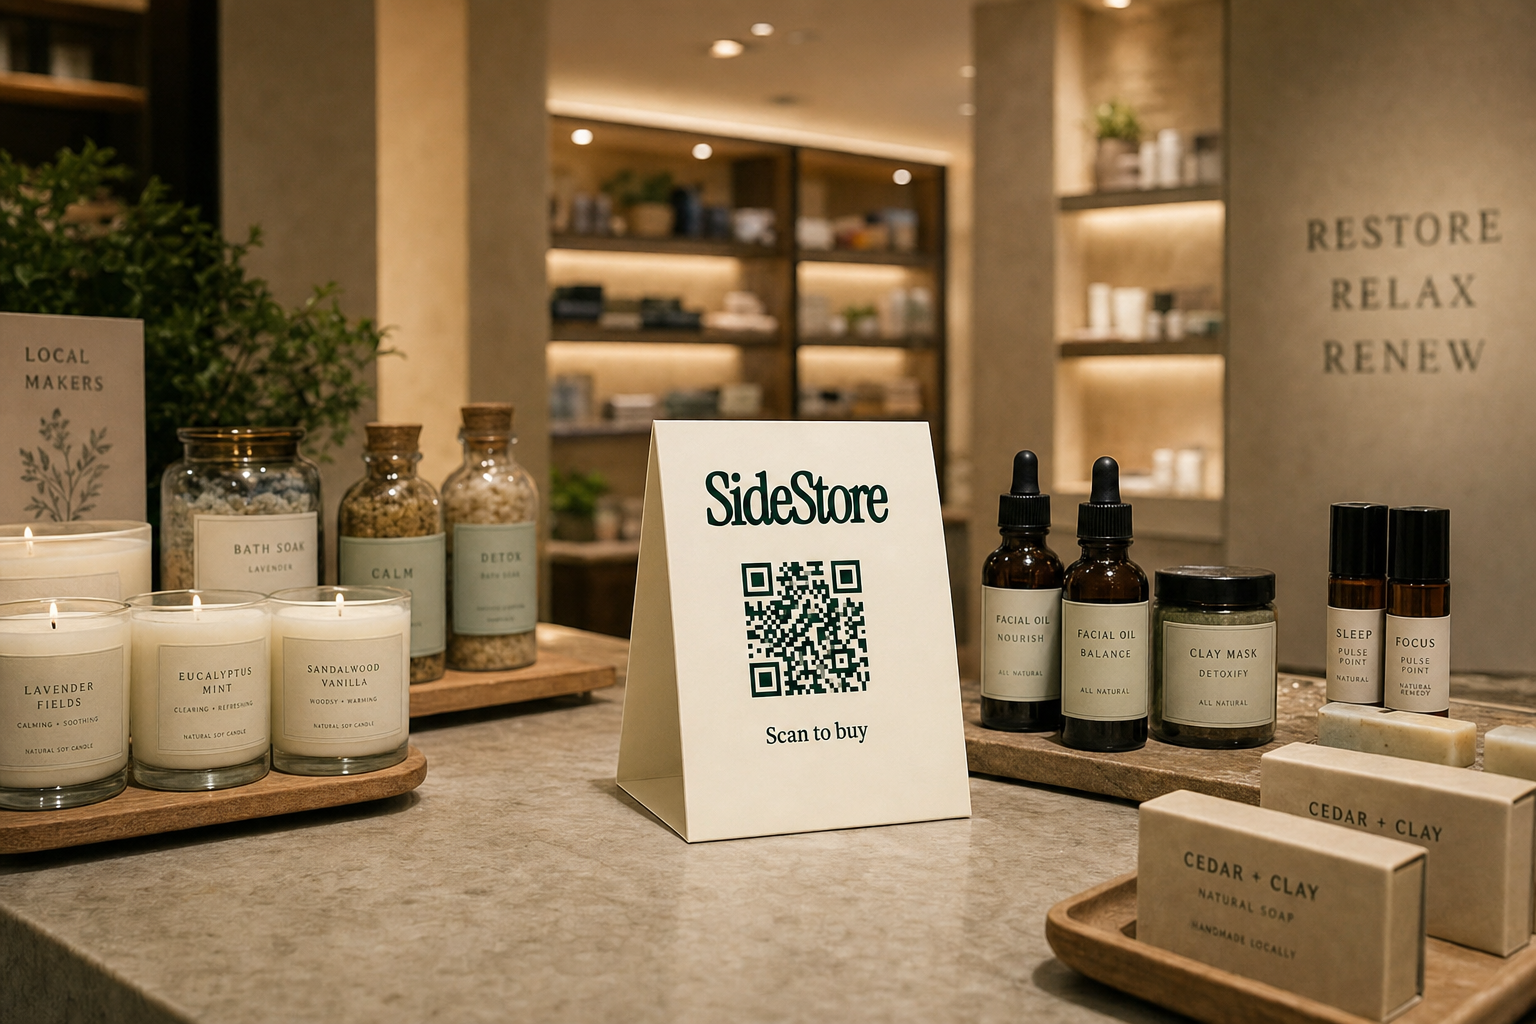
Start by isolating which placements are underperforming. A product that sells well in one venue but slowly in another is more likely a placement-fit problem than a product problem. Check whether the product is actually visible on the shelf, whether the price is appropriate for that venue's typical customer, and whether the replenishment cadence is matching demand. SideStore's Retail Widget tracks live stock and scans per placement, which gives you placement-level diagnostic data rather than blended averages. If a placement is generating scans but not sales, price is often the culprit. If scans are low, visibility or product-context fit is the issue.
To expand or shift placements, resources like guidance on approaching a local shop about stocking your products or retail placement alternatives can help you find better-fit venues.
For merchant hosts running a consignment shelf:
Review the range on offer. An underperforming shelf often contains too many similar products rather than a curated, complementary set. Discuss sell-through data transparently with your makers. Shared retail networks demonstrate that honest sell-through conversations between hosts and makers lead to faster product-mix adjustments than silence does.
Low sell-through in a consignment placement costs the merchant less than in a bought-in model, but idle shelf space still has an opportunity cost. Treat it as data, not a failure.
How to Track Sell-Through Rate: Spreadsheet vs. Software
You can track sell-through rate in a basic spreadsheet or with dedicated software. The spreadsheet approach works for small product ranges. Software becomes necessary once you have multiple placements across multiple venues.
Minimal spreadsheet structure:
| Column | Content |
|---|---|
| Product Name | SKU or descriptor |
| Units In | Stock received at start of period |
| Units Sold | Sales counted at end of period |
| Units Remaining | Units In minus Units Sold |
| Sell-Through % | (Units Sold ÷ Units In) × 100 |
| Period | Month and year |
Add a row per product per venue if you run multiple placements. The formula stays the same; the granularity is what changes.
The spreadsheet's limitation is manual data entry. Running five placements across five venues means reconciling five sets of numbers, and any lag in reporting from a host merchant creates blind spots.
SideStore's Retail Widget automates this at the placement level. Each scan-to-pay checkout updates live stock counts per placement automatically, so you see current sell-through without manual entry. For anyone managing multiple consignment locations, consignment inventory software options or a disciplined boutique inventory list practice are the two practical paths.
Sell-Through Rate in Consignment: What It Means for Makers and Host Merchants
In a consignment model, sell-through rate carries different stakes for each party. The maker cares about velocity: slow sell-through means capital tied up in stock sitting on someone else's shelf. The merchant cares about space productivity: slow sell-through means a shelf that could host a better-performing product.
Consignment percentage is the term for the revenue split between maker and merchant when a sale occurs. A typical arrangement might be 60% to the maker and 40% to the host, though terms vary. The split is agreed upfront, and SideStore's Retail Widget handles the automatic split payout at the point of sale, so neither party needs to reconcile manually.
What makes sell-through rate particularly important in consignment is that the merchant has no financial incentive to push a slow product, because they paid nothing for it. Makers who monitor sell-through per placement and act on underperformance quickly, by adjusting price, refreshing stock, or replacing slow lines with better-fit products, maintain better relationships with hosts and keep their shelf space active.
For makers considering where to start, guidance on pitching handmade products to boutiques, understanding collective and shared retail models, or selling local products to hotels on consignment can point you toward the right venue type for your category.
Frequently Asked Questions
These questions come up consistently among makers and merchant hosts.
How is sell-through rate calculated?
Sell-through rate is calculated as: (Units Sold ÷ Units Received) × 100. If you received 50 units and sold 35, your sell-through rate is 70%. Always specify the time period alongside the rate, as a monthly 70% and a quarterly 70% represent very different rates of inventory movement.
What counts as a good sell-through rate in retail?
By widely observed convention, 80% or above is strong, 60% to 80% is acceptable for many categories, and below 60% warrants investigation. Context matters: a hotel lobby shelf operates on a different rhythm than a fashion boutique. See the benchmark table above for context-specific ranges.
What is the difference between sell-through and inventory turnover?
Sell-through rate is a percentage showing what proportion of a specific stock intake sold in a defined period. Inventory turnover is an annualised ratio showing how many times your average inventory value cycled through in a year. Both measure inventory health, but on different time horizons and using different denominators.
How do sell-in, sell-through, and sell-out differ?
Sell-in is inventory shipped from a supplier to a retailer. Sell-through is what the retailer then sells to end customers. Sell-out refers to complete depletion of a product from shelves. In a direct maker-to-consignment-placement model, sell-in and sell-through often happen simultaneously, but the terminology distinction matters in wholesale and distributor contexts.
What is the meaning of sell-through in retail?
Sell-through rate is an inventory efficiency metric that tells you what percentage of the stock you brought in actually sold during a defined period. It is not a conversion rate, not a revenue metric, and not related to food-labeling terminology.
What does a sell-through date mean on products?
In retail analytics, a sell-through date is a projected date by which a batch of inventory will be fully sold, based on current sales velocity. It has no connection to food-labeling sell-by dates, which indicate product freshness. The two terms share a word, not a meaning.
What is the sell-through rate for an online marketplace store?
Online marketplace stores typically see lower sell-through rates than physical retail, often in the 40% to 60% range per month, due to larger SKU counts, longer customer consideration cycles, and the absence of impulse-purchase dynamics. These are general conventions; actual rates vary significantly by category. See retail margin benchmarks for coffee shops for an example of how physical retail context shapes the numbers differently.
How should sell-through rate be tracked in spreadsheets?
Use a table with columns for Product Name, Units In, Units Sold, Units Remaining, Sell-Through %, and Period. Apply the formula (Units Sold ÷ Units In) × 100 in the sell-through column. Add a row per product per venue if you manage multiple placements. For anyone managing consignment across several locations, dedicated software removes the manual reconciliation burden. For smaller ranges, selling art prints in local shops on consignment walks through a practical example of how makers track placement performance at a manageable scale.
The Bottom Line on Sell-Through Rate
Sell-through rate measures what percentage of received inventory sold in a given period. Aim for 80% or above where possible, treat 60% to 80% as workable depending on your category, and investigate anything below 60%. Context always qualifies the benchmark. For merchant hosts running consignment placements, a lower rate carries less financial risk than in a bought-in model, but idle shelf space still has a cost. For makers, per-placement tracking is the most actionable path forward. Start with placing art prints in cafes on consignment or review the mechanics of selling through someone else's store to put these benchmarks to immediate use.